Topview Trainer Debugger.
Topview Debugger is the most important facility meant for developing
8031microcontroller based Embedded Solutions. Debugging is an inevitable part in any
development environment to implement applications in real time. A right debugging tool
should save a lot of development time.
Topview Debugger gives you unmatched power to manage 8031 based projects.
This debugger is a two part program in which the major part stays inside of the Topview
trainer that keeps track of internal operation of the microcontrollers. During program
execution, it catches information on various registers contents, internal/external memory
areas and also various peripherals of the microcontrollers. This information is later
transferred to the host computer to which it is connected.
Second part of the debugger operates in the host computer and is responsible for
presenting the information received from the trainer in a most useful format using a GUI
environment.
The debugger presents a GUI environment in which the clearview window structure gives
facility for viewing/editing Program Memory, Internal Data Memory, information on various
internal registers, SFR bits and etc.
When you use clearview windows you can visualize all the changes happening in the
microcontroller’s internal architecture in a single screen. You can verify the
internal, external memory spaces, various registers, SFR bits, along with the program code
lines.
Another important feature of the debugger is the built-in program editing facility with
the provision to run an external assembler for assembling the edited input program file.
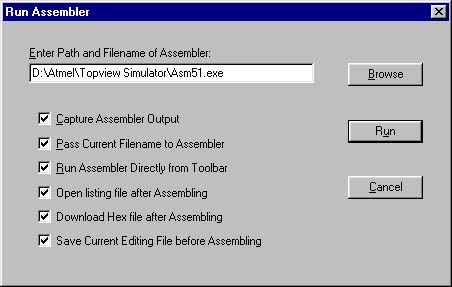
You can compose your target program in this editor and send the edited code into the
assembler and get the assembled code in a single shot.
There is an option to load the assembled code into the Trainer’s Program Memory at
the predefined location.
All this happens in a single step for your convenience.
In the Program Memory window, the address, opcodes and mnemonics with SFR names are
displayed line by line with distinct colours.
- The Program Memory sports a single line assembler. So you can simply enter your program
line by line using mnemonics.
- The window also disassembles the hex input file and generates the actual assembly
program.
- You can also download a binary or hex file in the Program Memory of the Trainer reading
from the disk.
- Similarly, you can store the contents of the Program Memory into the disk either in hex
or binary format.
- In the internal Data Memory window, you can view/edit the memory contents. Facility is
provided to Fill and Copy internal Data Memory contents.
- External Data Memory window also supports all the above mentioned and also sports the
facility to test the external Data Memory space.
- In the Register and SFR window, the names of all register are clearly displayed to make
you life easy during repeated debugging.
- There are many ways in which you control the program execution to suit your needs.
During every break, all the windows update their contents and indicate the changed values
in a different colour to grab your attention.
You can execute the total program in a single shot and then check for
the desired results.
You can also execute your program upto a Breakpoint and then verify the contents of
various registers and the memory. The breakpoint can be defined using registers, internal
Data Memory, SFR bits, External Data Memory.
There is another useful feature available to execute the subroutines in a single step. You
need not execute a subroutine block line by line.
Having described the debugger in detail, we are sure that you understand the clear
advantage you get when implementing your next embedded solution using Topview Debugger.
We once again remind you that a good debugging tool may save you from many hours of
frustration. You can also finish the project before the anticipated time.
Our experience shows that at least you can save about 30% of the development time when
using this powerful debugger.
|
