TMS320VC5416 Based Diamond Board.
TMS320VC5416 Diamond Board is an advanced platform to take up applications based on
VC5416. The diamond board comes with expansion
facilities to add application hardware without much efforts.
This VC5416 Diamond board is designed to motivate the designers to implement DSP projects with ease and confidence.
The Diamond board comes with a Ready-To-Use DSP Project Board to hook up your hardware.
Above all, this is the most affordable hardware solution for VC5416 projects
!

Specifications:
- TMS320VC5416 operating at 16-160MHz.
- Onchip RAM: 128K X 16.
- Onboard SOC to get different communication and booting facilities for the DSP.
- 2 Mbyte re-programmable flash memory space is available onboard to store application code with file management features.
- Many options to communicate with the host computer: RS232 Serial
Communication, USB Port.
- Emulator connecting facility.
- Application code generated from Code Composer Studio can be downloaded into the DSP.
- Operating at 5V @ 250mA.
- DSP bus lines are available in 2 numbers of 64 pin connectors to connect with the external add on hardware.

Topview DSP Debugger
Topview DSP Debugger is an important facility meant for developing TMS320VC5416 based embedded solutions. Debugging is an inevitable part in any tool suite required to develop applications in real time. A right debugging tool may save a lot of development time in any product development process.
An exclusive version of Topview DSP Debugger is made available for the DSP Starter kits and the Evaluation modules using TIĺs popular fixed point processor, TMS320VC5416.
This Debugger is a two part program in which major part stays inside the DSP hardware and keeps track of internal operation of the VC5416. This information is later transferred to the host computer to which it is connected. Since it is residing in the target hardware, sometimes it is also called ĹRemote Monitorĺ.

Second part of the debugger operates in the host computer and is responsible for presenting the information received from the target DSP hardware in a most useful format using a GUI environment.
When you establish a reliable serial or USB communication link between the DSP hardware and the host personal computer, the Topview DSP Debugger automatically comes into action.
The Debugger presents a GUI environment in which the ClearView Window structure gives facility for viewing complete information on the internal working of the VC5416.
Debugger sports following features:
- ClearView Window structure.
- Facility to load and execute the target program code generated by Code Composer Studio.
- Powerful program execution features like Single Step, Break Point and full speed.
- C Source and assembly level debugging with view/edit facility for variables.
- Graphical facility to generate Time Domain and Frequency Domain Waveforms.
- Facility to view the source level program using built-in text editor.
Each of these facilities are meant to give the DSP user the required power to study the field proven DSP hardware, then undertake DSP experiments to sharpen his/her knowledge and impart required confidence to undertake DSP based applications with ease.
ClearView Window Structure.
This is an optimized structure where windows are strategically placed in the display. Total display area is divided into three parts, which display the program lines, contents of the data memory and the contents of all the internal registers.

Debugging Target Program Code.
Using Texas Instruments Code Composer Studio software you can develop target application program. Topview Debugger enables you to debug the target application program both in C-Source level and assembly level.
Topview DSP Debugger window along with C Source Debugging environment:

Program Execution Facilities.
Topview Debugger gives you the power to execute your target program code in a variety of ways to suit your needs.
- Free running program execution.
- Program execution using multiple breakpoints.
- Executing program in single steps.
- Facility to execute CALLS in single steps.
During each execution, the ClearView updates all the relevant windows and present changed contents in different colors to draw your attention.
These facilities will become very helpful when developing complicated program codes.
Graphical Facility to generate Time Domain and Frequency Domain Waveforms.
This is another useful feature in which you can convert the sampled data into meaningful waveforms. You can generate both Frequency Domain and Time Domain Waveforms. These graphical windows are complete in all respects and you can read any coordinate of the waveform by just moving the mouse cursor.
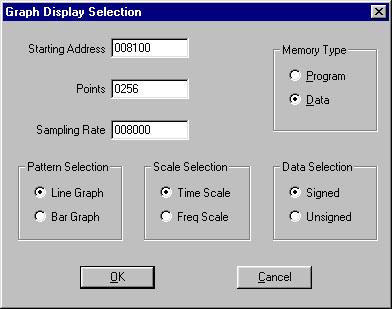


You can generate line graphs and bar graphs. Zoom in/out facilities are also available. You can even print out this waveform using any standard printer.
Program Examples.
Since the DSP subject is a complicated one, the debugger comes with a lot of tested and proven examples to give you a quick start in learning the DSP algorithms. These examples cover a wide range of algorithms.
|
